Resource Management with Remotely Sensed Data
Light Detection and Ranging (LiDAR) is a survey technique that uses airborne laser scanners to produce highly detailed 3d representations of large areas of land. LiDAR data can be analysed to reveal the detail of terrain beneath vegetation, the extent of infrastructure and the structure of tree canopy and sub-canopy vegetation.
Biosis understands the data requirements for resource management and routinely uses LiDAR datasets to create complex Geographical Information System (GIS) models, in conjunction with other datasets, to enable people to see patterns in the landscape that are otherwise hidden or difficult to detect using the naked eye.
Some of the detailed landscape models Biosis creates using LiDAR include:
- Hydrological modelli
- Tracing detailed surface water flow paths
- Calculating catchments and water yield
- Assessing flooding depths.
- Bushfire Attack Level modelling using relative slope angle, direction, distance and fuel type.
- Detailed vegetation change modelling over time. – Figure 1
- Identification of significant landscape features such as:
- Severe slopes or flat land
- Likely rock overhangs and cliffs
- Rocky outcrops, rises and ridges – Figure 2.
- Solar gain over particular time spans considering the position of the sun, latitude of location, length of the day and shadowing. – Figure 3
- Visibility to and from given points in the landscape (viewsheds).
LiDAR data can also be combined with other data to test hypothetical situations such as:
- The volume of fill required to level an area
- The height of vegetation or screening required to block an undesirable view
- How the flow of water across an area will be changed by excavation or filling.
Opportunities and constraints can be identified across wide areas by combining different datasets or the different outputs of LiDAR analysis to identify locations that satisfy the greatest number of desired criteria. For example, areas with the best combination of criteria relating to the flatness of the land, greatest view/best view of local landmarks, lowest flooding risk and requiring the least amount of tree clearing could be automatically identified using a single LiDAR dataset.
Biosis works closely with clients to design custom models to test each criterion and then combine them into maps and spatial data representing a sliding scale of how well any given location fits with these desirable criteria. Outputs can be combined with additional data such as land pricing and ownership information to identify potential acquisition properties.
As LiDAR data becomes more accessible across Australia it is being used more widely. Often organisations acquire LiDAR data for a specific purpose but don’t use the full potential of their datasets for the management and future use planning of their sites. Biosis can assist you to get the most out of your data.
For more information about how LiDAR could be used by your organisation or how you can get more out of LiDAR data you already have, call James Shepherd our Senior GIS analyst on 0407 512 187.
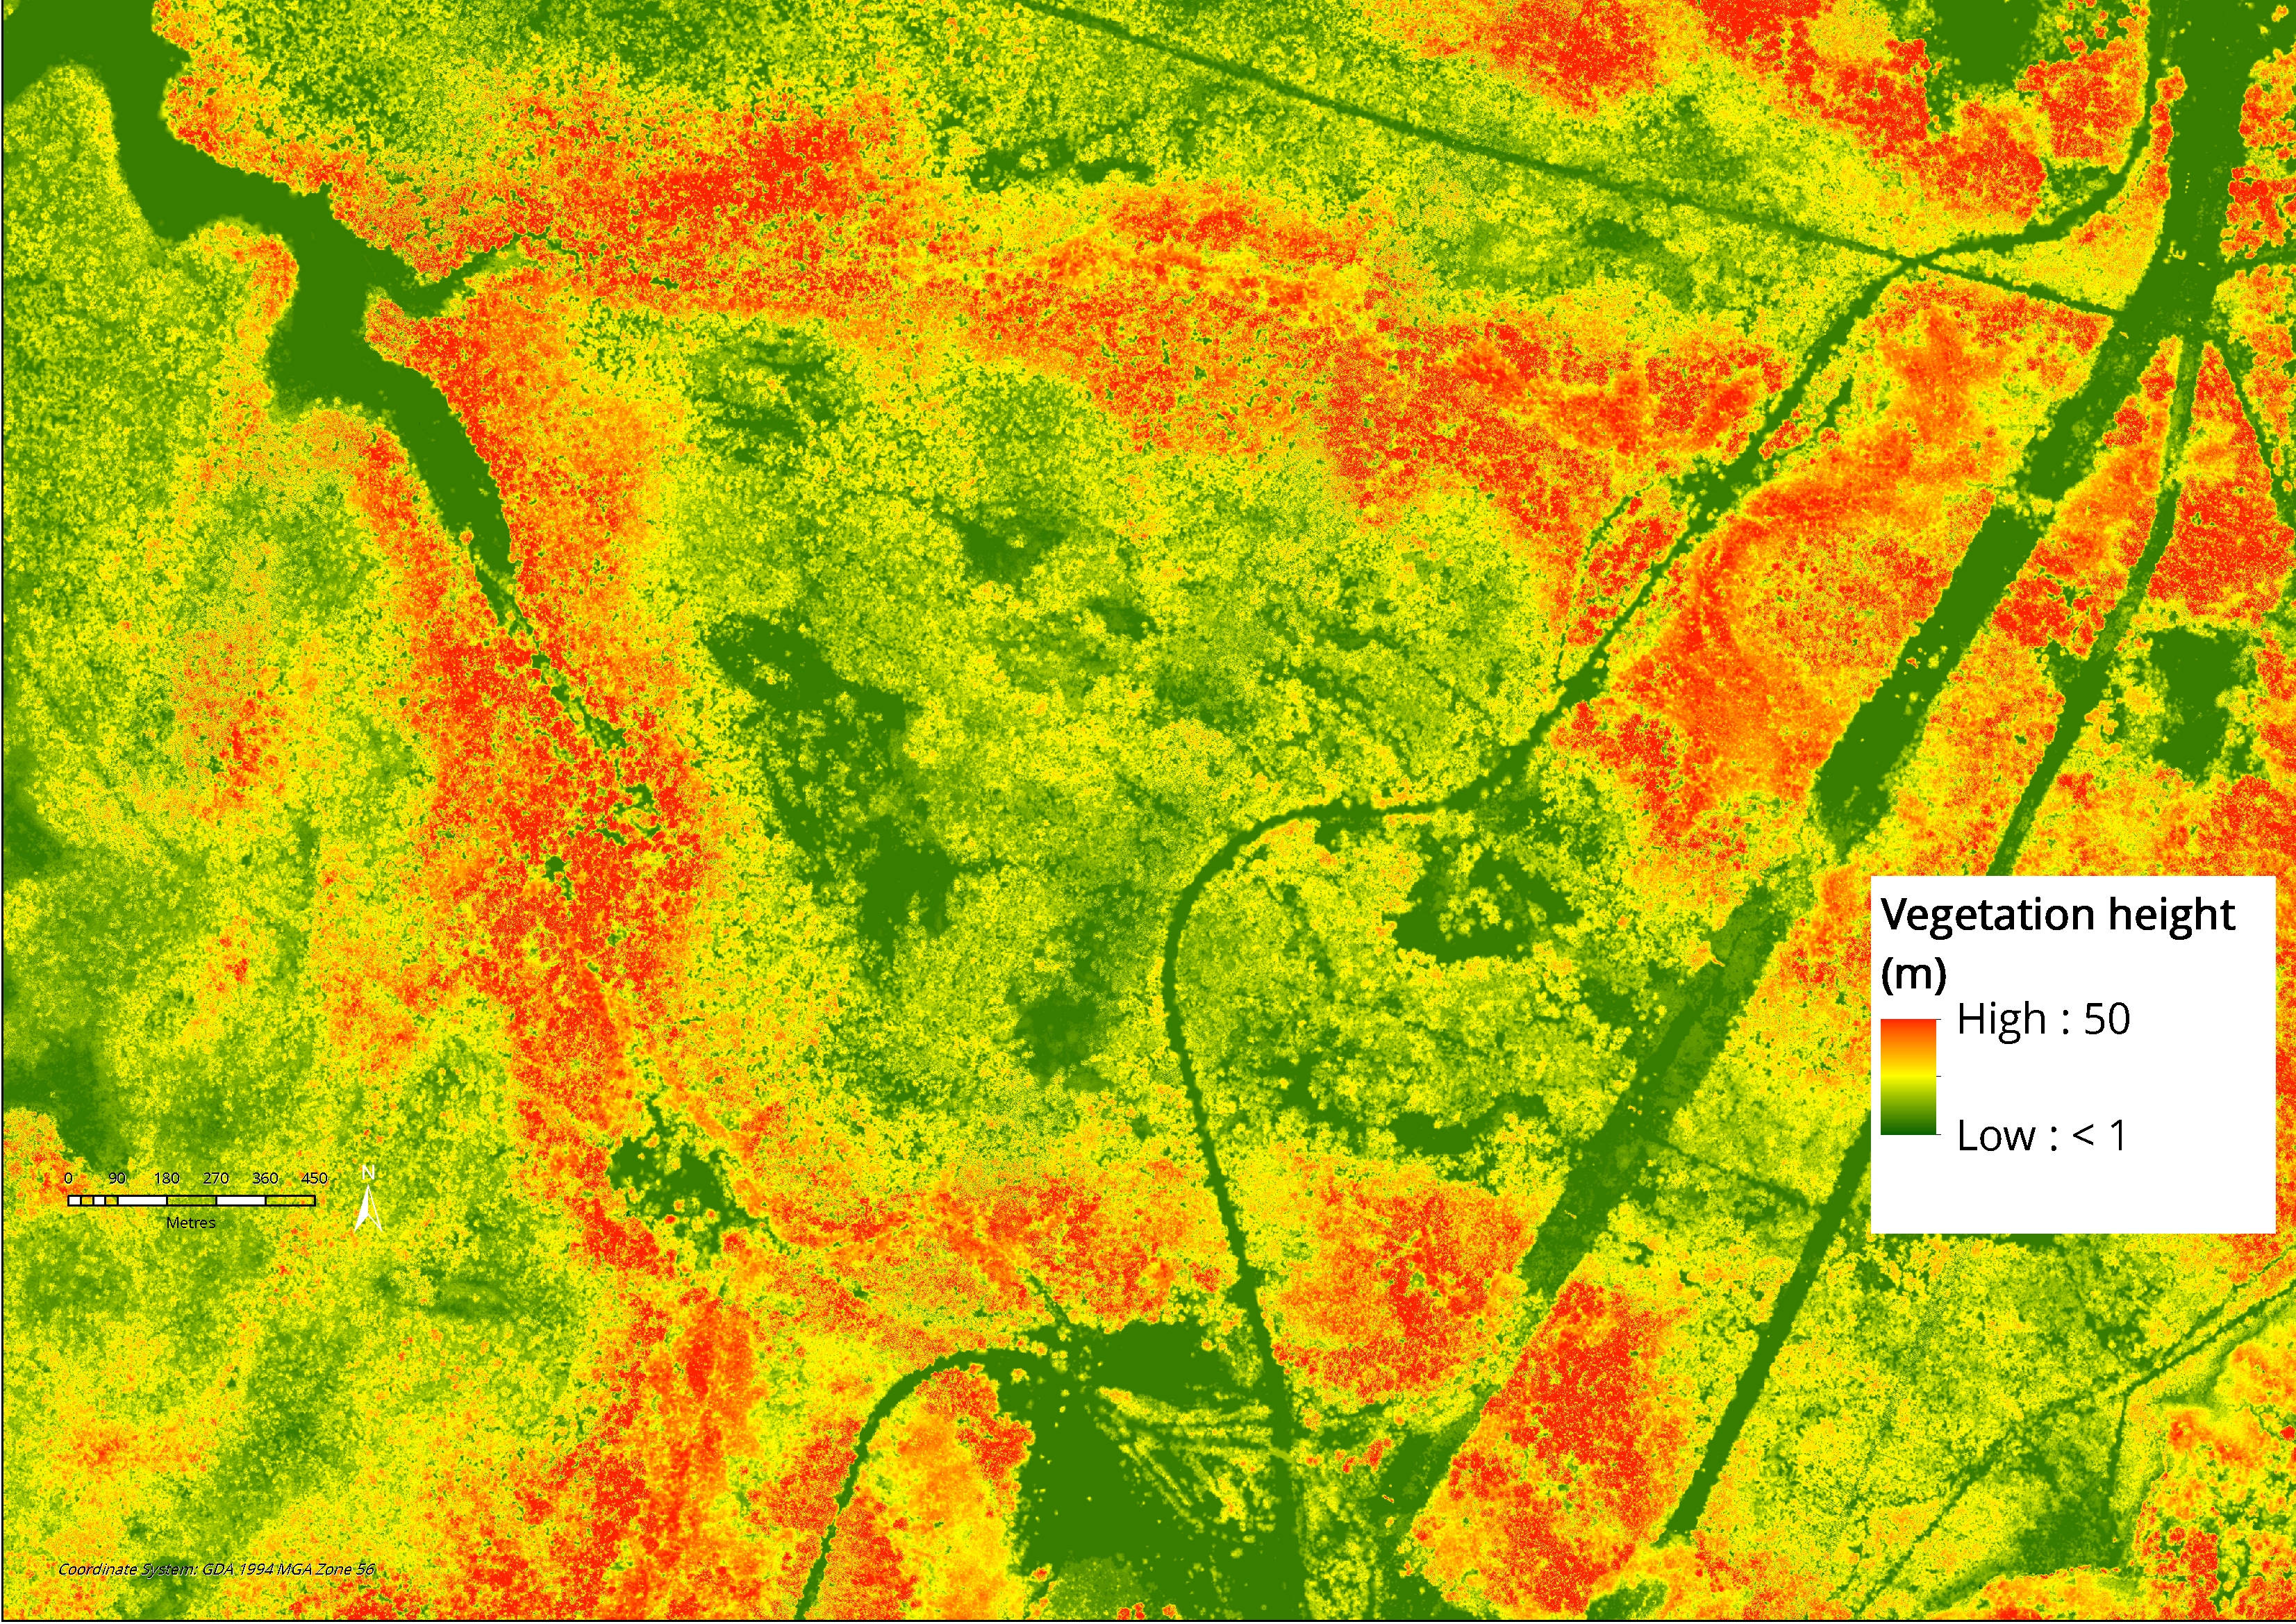
Figure 1: Results of LiDAR analysis showing the relative elevation (height from ground level) of vegetation. Red areas represent tall woodland. Green areas represent clearing, water areas, roads.
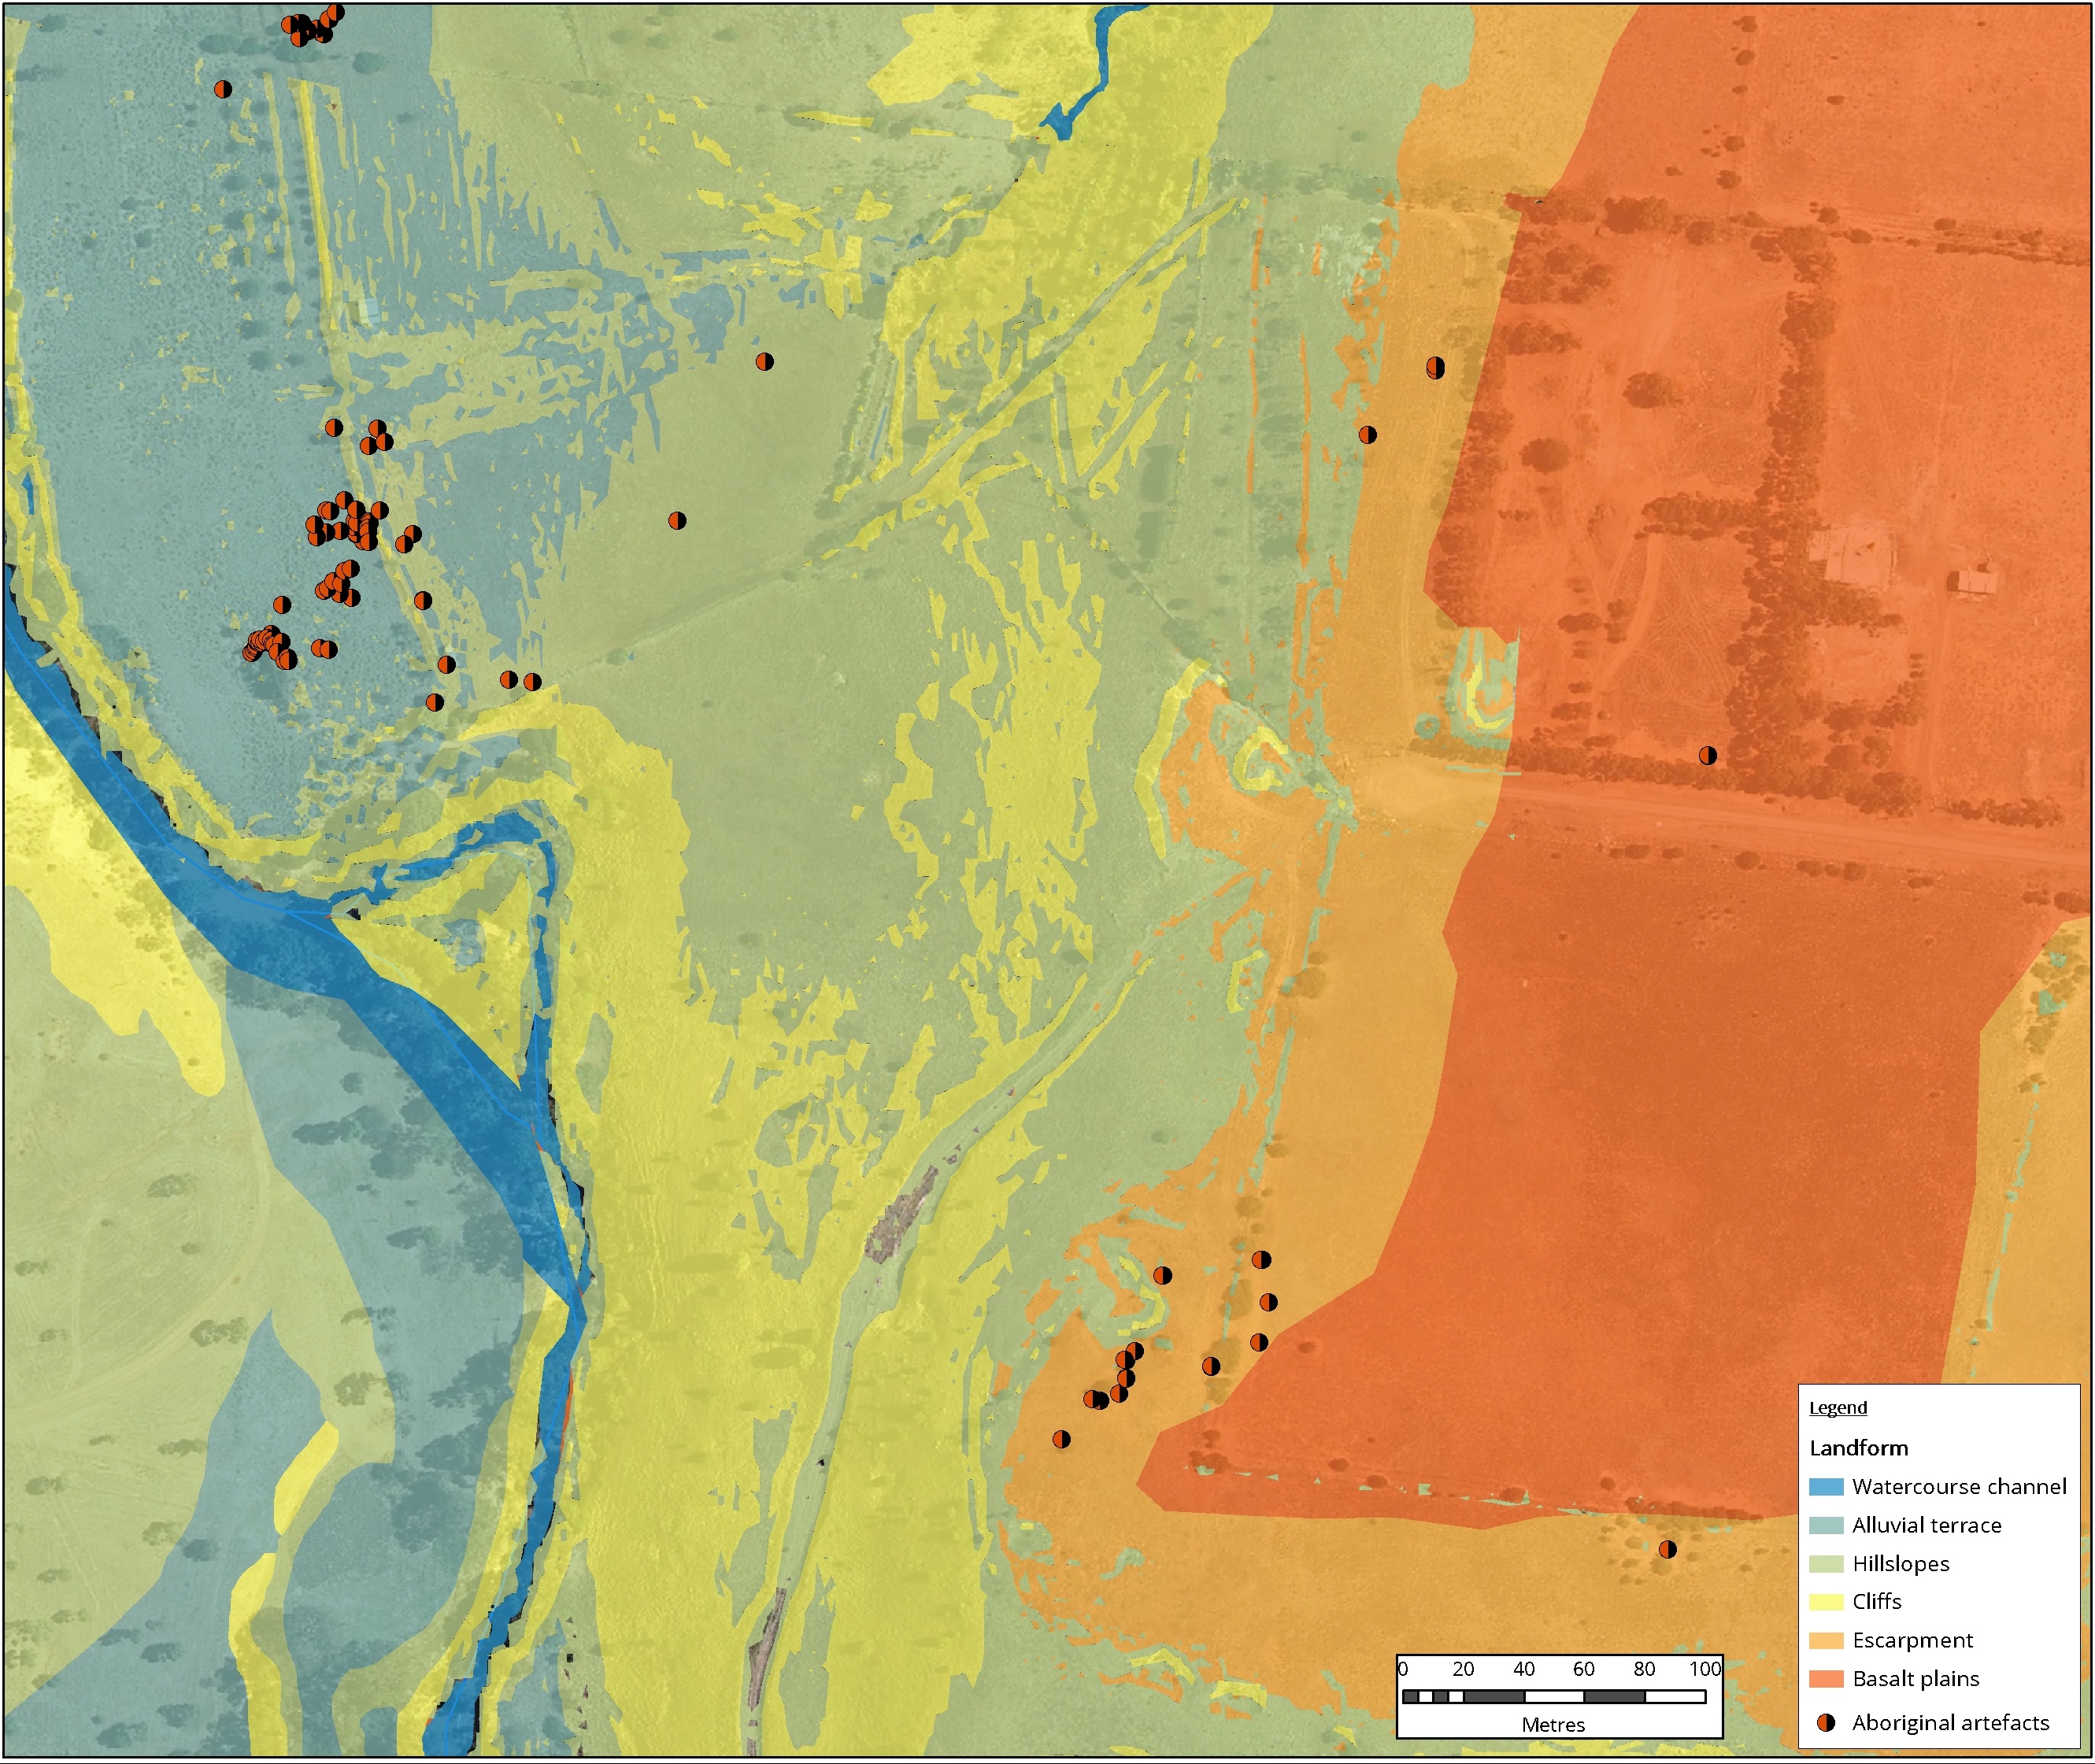
Figure 2: Concentrations of Aboriginal artefacts in relation to landform types. Landforms were created using custom GIS tools to process LiDAR data
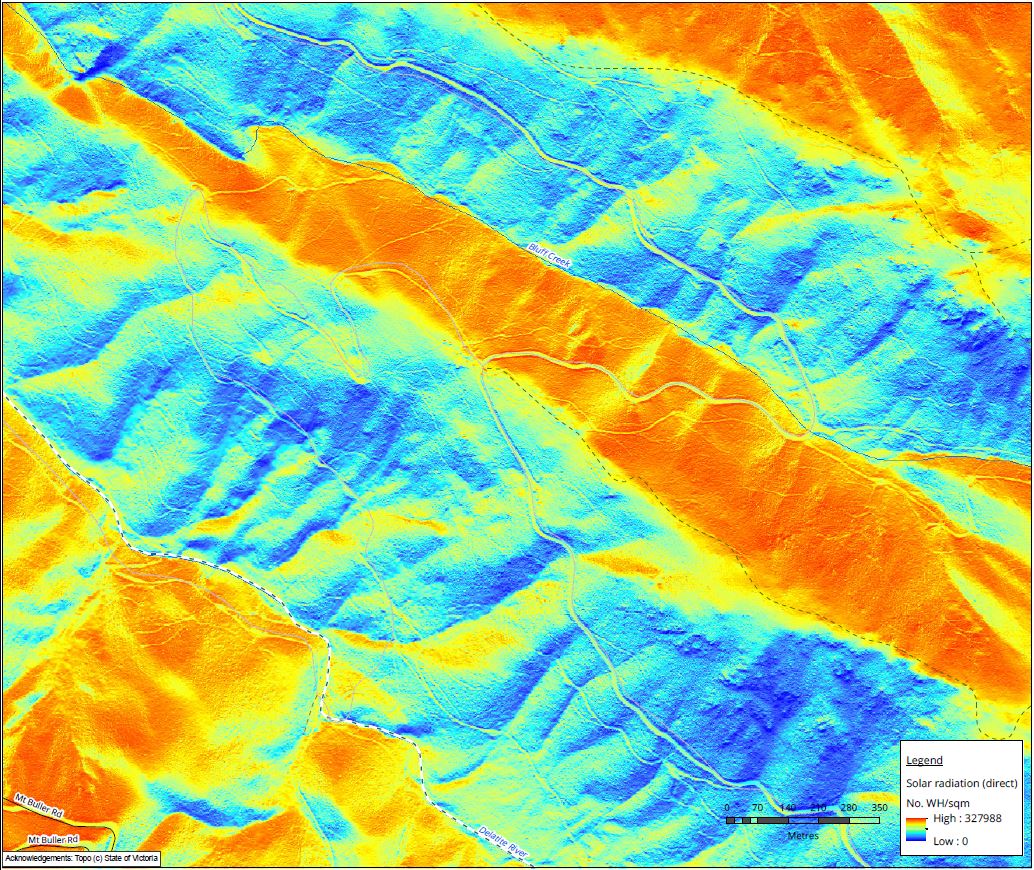
Figure 3: Direct solar gain analysis from LiDAR data showing the total predicted direct solar energy gain across alpine regions during the ski season. Values are shown in watt-hours per square metre (WH/sqm).